It’s summer, and the long-awaited Rstudio conference for 2022 is only days away. Next week, a large number of R aficionados will gather in Washington DC for the first time in person since the beginning of the pandemic. A pandemic, mind you, that is far from over. But Covid precautions are in place, and I trust the R community more than most to be responsible and thoughtful. With masks, social distance, and outdoor events: I’m excited to meet new people and see again many familiar faces from my first Rstudio conference in 2020.
To create even more excitement, this time I’m giving a talk about the Kaggle and R communities, and all the good things that can happen when those worlds interact. In addition to this talk, which is aiming at introducing an R audience to the opportunities of Kaggle, I have also prepared a new Kaggle dataset for this audience to get started on the platform. This post is about that dataset: comprehensive data on all R packages currently on CRAN, and on their full release history.
Let’s get started with the packages; including those that I found instrumental for querying info from CRAN: the powerful tools package and the more specialised packageRank package. Together, the functions in those packages made my task much easier than expected.
libs <- c('dplyr', 'tibble',       # wrangling
          'tidyr', 'stringr',      # wrangling
          'readr',                 # read files
          'tools', 'packageRank',  # CRAN package info
          'ggplot2', 'ggthemes',   # plots
          'gt', 'lubridate')       # tables & time
invisible(lapply(libs, library, character.only = TRUE))
Complete list of CRAN packages
Initially, my thought was to scrape the package information directly from CRAN, the Comprehensive R Archive Network. It is the central repository for R packages. CRAN describes itself as “a network of ftp and web servers around the world that store identical, up-to-date, versions of code and documentation for R.” If you’re installing an R package in the standard way then it is provided by one of the CRAN mirrors. (The install.packages function takes a repos argument that you can set to any of the mirror or to the central “http://cran.r-project.org”.)
CRAN provides full lists of all available package by name and by date of publication. The latter page in particular has a nice html table with all package names, titles, and dates. This would be easy to scrape. If you want to get an intro to webscraping with the rvest package then check out a previous blogpost of mine.
However, the R community had once again made my task much easier. As I was pondering a respectful and responsible scraping strategy, I came across this post on Scraping Responsibly with R by Steven Mortimer, who was working on scraping CRAN downloads. In it, he quoted a tweet by Maëlle Salmon recommending to use tools::CRAN_package_db instead as a gentler approach.
This tool is indeed very fast and powerful. It provides a lot of columns. For the sake of a simple dataset, I’m only selecting a subset of those features here. Feel free to explore the full range.
df <- tools::CRAN_package_db() %>%
  as_tibble() %>%
  janitor::clean_names() %>%
  select(package, version, depends, imports, license, needs_compilation, author, bug_reports, url, date_published = published, description, title) %>%
  mutate(needs_compilation = needs_compilation == "yes")
The columns I picked include names, versions, dates, and information about dependencies, authors, descriptions, and web links. Here are the first 50 rows:
df %>%
  head(50) %>%
  gt() %>%
  tab_header(
    title = md("**A full list of R packages on CRAN derived via tools::CRAN_package_db**")
    ) %>%
  opt_row_striping() %>%
tab_options(container.height = px(600))| A full list of R packages on CRAN derived via tools::CRAN_package_db | |||||||||||
|---|---|---|---|---|---|---|---|---|---|---|---|
| package | version | depends | imports | license | needs_compilation | author | bug_reports | url | date_published | description | title |
| A3 | 1.0.0 | R (>= 2.15.0), xtable, pbapply | NA | GPL (>= 2) | FALSE | Scott Fortmann-Roe | NA | NA | 2015-08-16 | Supplies tools for tabulating and analyzing the results of predictive models. The methods employed are applicable to virtually any predictive model and make comparisons between different methodologies straightforward. | Accurate, Adaptable, and Accessible Error Metrics for Predictive Models |
| AATtools | 0.0.1 | R (>= 3.6.0) | magrittr, dplyr, doParallel, foreach | GPL-3 | FALSE | Sercan Kahveci [aut, cre] | https://github.com/Spiritspeak/AATtools/issues | NA | 2020-06-14 | Compute approach bias scores using different scoring algorithms, compute bootstrapped and exact split-half reliability estimates, and compute confidence intervals for individual participant scores. | Reliability and Scoring Routines for the Approach-Avoidance Task |
| ABACUS | 1.0.0 | R (>= 3.1.0) | ggplot2 (>= 3.1.0), shiny (>= 1.3.1), | GPL-3 | FALSE | Mintu Nath [aut, cre] | NA | https://shiny.abdn.ac.uk/Stats/apps/ | 2019-09-20 | A set of Shiny apps for effective communication and understanding in statistics. The current version includes properties of normal distribution, properties of sampling distribution, one-sample z and t tests, two samples independent (unpaired) t test and analysis of variance. | Apps Based Activities for Communicating and Understanding Statistics |
| abbreviate | 0.1 | NA | NA | GPL-3 | FALSE | Sigbert Klinke [aut, cre] | NA | https://github.com/sigbertklinke/abbreviate (development version) | 2021-12-14 | Strings are abbreviated to at least "minlength" characters, such that they remain unique (if they were). The abbreviations should be recognisable. | Readable String Abbreviation |
| abbyyR | 0.5.5 | R (>= 3.2.0) | httr, XML, curl, readr, plyr, progress | MIT + file LICENSE | FALSE | Gaurav Sood [aut, cre] | http://github.com/soodoku/abbyyR/issues | http://github.com/soodoku/abbyyR | 2019-06-25 | Get text from images of text using Abbyy Cloud Optical Character Recognition (OCR) API. Easily OCR images, barcodes, forms, documents with machine readable zones, e.g. passports. Get the results in a variety of formats including plain text and XML. To learn more about the Abbyy OCR API, see <http://ocrsdk.com/>. | Access to Abbyy Optical Character Recognition (OCR) API |
| abc | 2.2.1 | R (>= 2.10), abc.data, nnet, quantreg, MASS, locfit | NA | GPL (>= 3) | FALSE | Csillery Katalin [aut], Lemaire Louisiane [aut], Francois Olivier [aut], Blum Michael [aut, cre] | NA | NA | 2022-05-19 | Implements several ABC algorithms for performing parameter estimation, model selection, and goodness-of-fit. Cross-validation tools are also available for measuring the accuracy of ABC estimates, and to calculate the misclassification probabilities of different models. | Tools for Approximate Bayesian Computation (ABC) |
| abc.data | 1.0 | R (>= 2.10) | NA | GPL (>= 3) | FALSE | Csillery Katalin [aut], Lemaire Louisiane [aut], Francois Olivier [aut], Blum Michael [aut, cre] | NA | NA | 2015-05-05 | Contains data which are used by functions of the 'abc' package. | Data Only: Tools for Approximate Bayesian Computation (ABC) |
| ABC.RAP | 0.9.0 | R (>= 3.1.0) | graphics, stats, utils | GPL-3 | FALSE | Abdulmonem Alsaleh [cre, aut], Robert Weeks [aut], Ian Morison [aut], RStudio [ctb] | NA | NA | 2016-10-20 | It aims to identify candidate genes that are “differentially methylated” between cases and controls. It applies Student’s t-test and delta beta analysis to identify candidate genes containing multiple “CpG sites”. | Array Based CpG Region Analysis Pipeline |
| abcADM | 1.0 | NA | Rcpp (>= 1.0.1) | GPL-3 | TRUE | Zongjun Liu [aut], Chun-Hao Yang [aut], John Burkardt [ctb], Samuel W.K. Wong [aut, cre] | NA | NA | 2019-11-13 | Estimate parameters of accumulated damage (load duration) models based on failure time data under a Bayesian framework, using Approximate Bayesian Computation (ABC). Assess long-term reliability under stochastic load profiles. Yang, Zidek, and Wong (2019) <doi:10.1080/00401706.2018.1512900>. | Fit Accumulated Damage Models and Estimate Reliability using ABC |
| ABCanalysis | 1.2.1 | R (>= 2.10) | plotrix | GPL-3 | FALSE | Michael Thrun, Jorn Lotsch, Alfred Ultsch | NA | https://www.uni-marburg.de/fb12/datenbionik/software-en | 2017-03-13 | For a given data set, the package provides a novel method of computing precise limits to acquire subsets which are easily interpreted. Closely related to the Lorenz curve, the ABC curve visualizes the data by graphically representing the cumulative distribution function. Based on an ABC analysis the algorithm calculates, with the help of the ABC curve, the optimal limits by exploiting the mathematical properties pertaining to distribution of analyzed items. The data containing positive values is divided into three disjoint subsets A, B and C, with subset A comprising very profitable values, i.e. largest data values ("the important few"), subset B comprising values where the yield equals to the effort required to obtain it, and the subset C comprising of non-profitable values, i.e., the smallest data sets ("the trivial many"). Package is based on "Computed ABC Analysis for rational Selection of most informative Variables in multivariate Data", PLoS One. Ultsch. A., Lotsch J. (2015) <DOI:10.1371/journal.pone.0129767>. | Computed ABC Analysis |
| abclass | 0.3.0 | R (>= 3.5.0) | Rcpp, stats | GPL (>= 3) | TRUE | Wenjie Wang [aut, cre] (<https://orcid.org/0000-0003-0363-3180>), Eli Lilly and Company [cph] | https://github.com/wenjie2wang/abclass/issues | https://wwenjie.org/abclass, https://github.com/wenjie2wang/abclass | 2022-05-28 | Multi-category angle-based large-margin classifiers. See Zhang and Liu (2014) <doi:10.1093/biomet/asu017> for details. | Angle-Based Large-Margin Classifiers |
| ABCoptim | 0.15.0 | NA | Rcpp, graphics, stats, utils | MIT + file LICENSE | TRUE | George Vega Yon [aut, cre], Enyelbert Muñoz [ctb] | NA | http://github.com/gvegayon/ABCoptim, http://mf.erciyes.edu.tr/abc/ | 2017-11-06 | An implementation of Karaboga (2005) Artificial Bee Colony Optimization algorithm <http://mf.erciyes.edu.tr/abc/pub/tr06_2005.pdf>. This (working) version is a Work-in-progress, which is why it has been implemented using pure R code. This was developed upon the basic version programmed in C and distributed at the algorithm's official website. | Implementation of Artificial Bee Colony (ABC) Optimization |
| ABCp2 | 1.2 | MASS | NA | GPL-2 | FALSE | M. Catherine Duryea, Andrew D. Kern, Robert M. Cox, and Ryan Calsbeek | NA | NA | 2016-02-04 | Tests the goodness of fit of a distribution of offspring to the Normal, Poisson, and Gamma distribution and estimates the proportional paternity of the second male (P2) based on the best fit distribution. | Approximate Bayesian Computational Model for Estimating P2 |
| abcrlda | 1.0.3 | NA | stats | GPL-3 | FALSE | Dmitriy Fedorov [aut, cre], Amin Zollanvari [aut], Aresh Dadlani [aut], Berdakh Abibullaev [aut] | NA | https://ieeexplore.ieee.org/document/8720003/, https://dx.doi.org/10.1109/LSP.2019.2918485 | 2020-05-28 | Offers methods to perform asymptotically bias-corrected regularized linear discriminant analysis (ABC_RLDA) for cost-sensitive binary classification. The bias-correction is an estimate of the bias term added to regularized discriminant analysis (RLDA) that minimizes the overall risk. The default magnitude of misclassification costs are equal and set to 0.5; however, the package also offers the options to set them to some predetermined values or, alternatively, take them as hyperparameters to tune. A. Zollanvari, M. Abdirash, A. Dadlani and B. Abibullaev (2019) <doi:10.1109/LSP.2019.2918485>. | Asymptotically Bias-Corrected Regularized Linear Discriminant Analysis |
| abctools | 1.1.3 | R (>= 2.10), abc, abind, parallel, plyr, Hmisc | NA | GPL (>= 2) | TRUE | Matt Nunes [aut, cre], Dennis Prangle [aut], Guilhereme Rodrigues [ctb] | https://github.com/dennisprangle/abctools/issues | https://github.com/dennisprangle/abctools | 2018-07-17 | Tools for approximate Bayesian computation including summary statistic selection and assessing coverage. | Tools for ABC Analyses |
| abd | 0.2-8 | R (>= 3.0), nlme, lattice, grid, mosaic | NA | GPL-2 | FALSE | Kevin M. Middleton <middletonk@missouri.edu>, Randall Pruim <rpruim@calvin.edu> | NA | NA | 2015-07-03 | The abd package contains data sets and sample code for The Analysis of Biological Data by Michael Whitlock and Dolph Schluter (2009; Roberts & Company Publishers). | The Analysis of Biological Data |
| abdiv | 0.2.0 | NA | ape | MIT + file LICENSE | FALSE | Kyle Bittinger [aut, cre] | https://github.com/kylebittinger/abdiv/issues | https://github.com/kylebittinger/abdiv | 2020-01-20 | A collection of measures for measuring ecological diversity. Ecological diversity comes in two flavors: alpha diversity measures the diversity within a single site or sample, and beta diversity measures the diversity across two sites or samples. This package overlaps considerably with other R packages such as 'vegan', 'gUniFrac', 'betapart', and 'fossil'. We also include a wide range of functions that are implemented in software outside the R ecosystem, such as 'scipy', 'Mothur', and 'scikit-bio'. The implementations here are designed to be basic and clear to the reader. | Alpha and Beta Diversity Measures |
| abe | 3.0.1 | NA | NA | GPL (>= 2) | FALSE | Rok Blagus [aut, cre], Sladana Babic [ctb] | NA | NA | 2017-10-30 | Performs augmented backward elimination and checks the stability of the obtained model. Augmented backward elimination combines significance or information based criteria with the change in estimate to either select the optimal model for prediction purposes or to serve as a tool to obtain a practically sound, highly interpretable model. More details can be found in Dunkler et al. (2014) <doi:10.1371/journal.pone.0113677>. | Augmented Backward Elimination |
| abess | 0.4.5 | R (>= 3.1.0) | Rcpp, MASS, methods, Matrix | GPL (>= 3) | file LICENSE | TRUE | Jin Zhu [aut, cre] (<https://orcid.org/0000-0001-8550-5822>), Liyuan Hu [aut], Junhao Huang [aut], Kangkang Jiang [aut], Yanhang Zhang [aut], Zezhi Wang [aut], Borui Tang [aut], Shiyun Lin [aut], Junxian Zhu [aut], Canhong Wen [aut], Heping Zhang [aut] (<https://orcid.org/0000-0002-0688-4076>), Xueqin Wang [aut] (<https://orcid.org/0000-0001-5205-9950>), spectra contributors [cph] (Spectra implementation) | https://github.com/abess-team/abess/issues | https://github.com/abess-team/abess, https://abess-team.github.io/abess/, https://abess.readthedocs.io | 2022-03-22 | Extremely efficient toolkit for solving the best subset selection problem <arXiv:2110.09697>. This package is its R interface. The package implements and generalizes algorithms designed in <doi:10.1073/pnas.2014241117> that exploits a novel sequencing-and-splicing technique to guarantee exact support recovery and globally optimal solution in polynomial times for linear model. It also supports best subset selection for logistic regression, Poisson regression, Cox proportional hazard model, Gamma regression, multiple-response regression, multinomial logistic regression, ordinal regression, (sequential) principal component analysis, and robust principal component analysis. The other valuable features such as the best subset of group selection <arXiv:2104.12576> and sure independence screening <doi:10.1111/j.1467-9868.2008.00674.x> are also provided. | Fast Best Subset Selection |
| abglasso | 0.1.1 | NA | MASS, pracma, stats, statmod | GPL-3 | FALSE | Jarod Smith [aut, cre] (<https://orcid.org/0000-0003-4235-6147>), Mohammad Arashi [aut] (<https://orcid.org/0000-0003-4793-5674>), Andriette Bekker [aut] (<https://orcid.org/0000-0002-5881-9241>) | NA | NA | 2021-07-13 | Implements a Bayesian adaptive graphical lasso data-augmented block Gibbs sampler. The sampler simulates the posterior distribution of precision matrices of a Gaussian Graphical Model. This sampler was adapted from the original MATLAB routine proposed in Wang (2012) <doi:10.1214/12-BA729>. | Adaptive Bayesian Graphical Lasso |
| ABHgenotypeR | 1.0.1 | NA | ggplot2, reshape2, utils | GPL-3 | FALSE | Stefan Reuscher [aut, cre], Tomoyuki Furuta [aut] | http://github.com/StefanReuscher/ABHgenotypeR/issues | http://github.com/StefanReuscher/ABHgenotypeR | 2016-02-04 | Easy to use functions to visualize marker data from biparental populations. Useful for both analyzing and presenting genotypes in the ABH format. | Easy Visualization of ABH Genotypes |
| abind | 1.4-5 | R (>= 1.5.0) | methods, utils | LGPL (>= 2) | FALSE | Tony Plate <tplate@acm.org> and Richard Heiberger | NA | NA | 2016-07-21 | Combine multidimensional arrays into a single array. This is a generalization of 'cbind' and 'rbind'. Works with vectors, matrices, and higher-dimensional arrays. Also provides functions 'adrop', 'asub', and 'afill' for manipulating, extracting and replacing data in arrays. | Combine Multidimensional Arrays |
| abjData | 1.1.2 | R (>= 3.3.1) | NA | MIT + file LICENSE | FALSE | Julio Trecenti [aut, cre] (<https://orcid.org/0000-0002-1680-6389>), Renata Hirota [ctb], Katerine Witkoski [aut] (<https://orcid.org/0000-0002-3691-6569>), Associação Brasileira de Jurimetria [cph, fnd] | NA | https://abjur.github.io/abjData/ | 2022-06-15 | The Brazilian Jurimetrics Association (ABJ in Portuguese, see <https://abj.org.br/> for more information) is a non-profit organization which aims to investigate and promote the use of statistics and probability in the study of Law and its institutions. This package has a set of datasets commonly used in our book. | Databases Used Routinely by the Brazilian Jurimetrics Association |
| abjutils | 0.3.2 | R (>= 3.6) | dplyr, magrittr, purrr, rlang, rstudioapi, stringi, stringr, tidyr | MIT + file LICENSE | FALSE | Caio Lente [aut, cre] (<https://orcid.org/0000-0001-8473-069X>), Julio Trecenti [aut] (<https://orcid.org/0000-0002-1680-6389>), Katerine Witkoski [ctb] (<https://orcid.org/0000-0002-3691-6569>), Associação Brasileira de Jurimetria [cph, fnd] | NA | https://github.com/abjur/abjutils | 2022-02-01 | The Brazilian Jurimetrics Association (ABJ in Portuguese, see <https://abj.org.br/> for more information) is a non-profit organization which aims to investigate and promote the use of statistics and probability in the study of Law and its institutions. This package implements general purpose tools used by ABJ, such as functions for sampling and basic manipulation of Brazilian lawsuits identification number. It also implements functions for text cleaning, such as accentuation removal. | Useful Tools for Jurimetrical Analysis Used by the Brazilian Jurimetrics Association |
| abn | 2.7-1 | R (>= 4.0.0) | methods, rjags, nnet, lme4, graph, Rgraphviz, doParallel, foreach | GPL (>= 2) | TRUE | Reinhard Furrer [cre, aut] (<https://orcid.org/0000-0002-6319-2332>), Gilles Kratzer [aut] (<https://orcid.org/0000-0002-5929-8935>), Fraser Iain Lewis [aut] (<https://orcid.org/0000-0003-4580-2712>), Marta Pittavino [ctb] (<https://orcid.org/0000-0002-1232-1034>), Kalina Cherneva [ctr] | https://git.math.uzh.ch/reinhard.furrer/abn/-/issues | http://r-bayesian-networks.org | 2022-04-25 | Bayesian network analysis is a form of probabilistic graphical models which derives from empirical data a directed acyclic graph, DAG, describing the dependency structure between random variables. An additive Bayesian network model consists of a form of a DAG where each node comprises a generalized linear model, GLM. Additive Bayesian network models are equivalent to Bayesian multivariate regression using graphical modelling, they generalises the usual multivariable regression, GLM, to multiple dependent variables. 'abn' provides routines to help determine optimal Bayesian network models for a given data set, where these models are used to identify statistical dependencies in messy, complex data. The additive formulation of these models is equivalent to multivariate generalised linear modelling (including mixed models with iid random effects). The usual term to describe this model selection process is structure discovery. The core functionality is concerned with model selection - determining the most robust empirical model of data from interdependent variables. Laplace approximations are used to estimate goodness of fit metrics and model parameters, and wrappers are also included to the INLA package which can be obtained from <https://www.r-inla.org>. The computing library JAGS <https://mcmc-jags.sourceforge.io> is used to simulate 'abn'-like data. A comprehensive set of documented case studies, numerical accuracy/quality assurance exercises, and additional documentation are available from the 'abn' website <http://r-bayesian-networks.org>. | Modelling Multivariate Data with Additive Bayesian Networks |
| abnormality | 0.1.0 | NA | MASS (>= 7.3.0), Matrix | MIT + file LICENSE | FALSE | Michael Marks [aut, cre] | NA | NA | 2018-03-13 | Contains the functions to implement the methodology and considerations laid out by Marks et al. in the manuscript Measuring Abnormality in High Dimensional Spaces: Applications in Biomechanical Gait Analysis. As of 2/27/2018 this paper has been submitted and is under scientific review. Using high-dimensional datasets to measure a subject’s overall level of abnormality as compared to a reference population is often needed in outcomes research. Utilizing applications in instrumented gait analysis, that article demonstrates how using data that is inherently non-independent to measure overall abnormality may bias results. A methodology is introduced to address this bias to accurately measure overall abnormality in high dimensional spaces. While this methodology is in line with previous literature, it differs in two major ways. Advantageously, it can be applied to datasets in which the number of observations is less than the number of features/variables, and it can be abstracted to practically any number of domains or dimensions. After applying the proposed methodology to the original data, the researcher is left with a set of uncorrelated variables (i.e. principal components) with which overall abnormality can be measured without bias. Different considerations are discussed in that article in deciding the appropriate number of principal components to keep and the aggregate distance measure to utilize. | Measure a Subject's Abnormality with Respect to a Reference Population |
| abodOutlier | 0.1 | cluster, R (>= 3.1.2) | NA | MIT + file LICENSE | FALSE | Jose Jimenez <jose@jimenezluna.com> | NA | NA | 2015-08-31 | Performs angle-based outlier detection on a given dataframe. Three methods are available, a full but slow implementation using all the data that has cubic complexity, a fully randomized one which is way more efficient and another using k-nearest neighbours. These algorithms are specially well suited for high dimensional data outlier detection. | Angle-Based Outlier Detection |
| ABPS | 0.3 | NA | kernlab | GPL (>= 2) | FALSE | Frédéric Schütz [aut, cre], Alix Zollinger [aut] | NA | NA | 2018-10-18 | An implementation of the Abnormal Blood Profile Score (ABPS, part of the Athlete Biological Passport program of the World Anti-Doping Agency), which combines several blood parameters into a single score in order to detect blood doping (Sottas et al. (2006) <doi:10.2202/1557-4679.1011>). The package also contains functions to calculate other scores used in anti-doping programs, such as the OFF-score (Gore et al. (2003) <http://www.haematologica.org/content/88/3/333>), as well as example data. | The Abnormal Blood Profile Score to Detect Blood Doping |
| abstr | 0.4.1 | R (>= 4.0.0) | jsonlite (>= 1.7.2), lwgeom (>= 0.2.5), magrittr (>= 2.0.1), methods, od (>= 0.3.1), sf (>= 1.0.1), tibble (>= 3.0.6), tidyr (>= 1.1.3) | Apache License (>= 2) | FALSE | Nathanael Sheehan [aut, cre] (<https://orcid.org/0000-0002-2779-0976>), Robin Lovelace [aut] (<https://orcid.org/0000-0001-5679-6536>), Trevor Nederlof [aut], Lucas Dias [ctb], Dustin Carlino [aut] | https://github.com/a-b-street/abstr/issues | https://github.com/a-b-street/abstr, https://a-b-street.github.io/abstr/ | 2021-11-30 | Provides functions to convert origin-destination data, represented as straight 'desire lines' in the 'sf' Simple Features class system, into JSON files that can be directly imported into A/B Street <https://www.abstreet.org>, a free and open source tool for simulating urban transport systems and scenarios of change <doi:10.1007/s10109-020-00342-2>. | R Interface to the A/B Street Transport System Simulation Software |
| abstractr | 0.1.0 | NA | shiny (>= 1.2.0), ggplot2 (>= 3.0.0), gridExtra (>= 2.3.0), colourpicker, shinythemes, emojifont, rintrojs | GPL-3 | FALSE | Matthew Kumar <mattkumar@gmail.com> | NA | https://matt-kumar.shinyapps.io/portfolio | 2019-01-20 | An R-Shiny application to create visual abstracts for original research. A variety of user defined options and formatting are included. | An R-Shiny Application for Creating Visual Abstracts |
| abtest | 1.0.1 | R (>= 3.0.0) | Rcpp (>= 0.12.14), mvtnorm, sn, qgam, truncnorm, plotrix, grDevices, RColorBrewer, Matrix, parallel | GPL (>= 2) | TRUE | Quentin F. Gronau [aut, cre], Akash Raj [ctb], Eric-Jan Wagenmakers [ths] | NA | NA | 2021-11-22 | Provides functions for Bayesian A/B testing including prior elicitation options based on Kass and Vaidyanathan (1992) <doi:10.1111/j.2517-6161.1992.tb01868.x>. Gronau, Raj K. N., & Wagenmakers (2021) <doi:10.18637/jss.v100.i17>. | Bayesian A/B Testing |
| abundant | 1.2 | R (>= 2.10), glasso | NA | GPL-2 | TRUE | Adam J. Rothman | NA | NA | 2022-01-04 | Fit and predict with the high-dimensional principal fitted components model. This model is described by Cook, Forzani, and Rothman (2012) <doi:10.1214/11-AOS962>. | High-Dimensional Principal Fitted Components and Abundant Regression |
| Ac3net | 1.2.2 | R (>= 3.3.0), data.table | NA | GPL (>= 3) | FALSE | Gokmen Altay | NA | NA | 2018-02-26 | Infers directional conservative causal core (gene) networks. It is an advanced version of the algorithm C3NET by providing directional network. Gokmen Altay (2018) <doi:10.1101/271031>, bioRxiv. | Inferring Directional Conservative Causal Core Gene Networks |
| ACA | 1.1 | R (>= 3.2.2) | graphics, grDevices, stats, utils | GPL | FALSE | Daniel Amorese | NA | NA | 2018-07-02 | Offers an interactive function for the detection of breakpoints in series. | Abrupt Change-Point or Aberration Detection in Point Series |
| academictwitteR | 0.3.1 | R (>= 3.4) | dplyr (>= 1.0.0), httr, jsonlite, magrittr, lubridate, usethis, tibble, tidyr, tidyselect, purrr, rlang, utils | MIT + file LICENSE | FALSE | Christopher Barrie [aut, cre] (<https://orcid.org/0000-0002-9156-990X>), Justin Chun-ting Ho [aut] (<https://orcid.org/0000-0002-7884-1059>), Chung-hong Chan [ctb] (<https://orcid.org/0000-0002-6232-7530>), Noelia Rico [ctb] (<https://orcid.org/0000-0002-6169-4523>), Tim König [ctb] (<https://orcid.org/0000-0002-2852-2690>), Thomas Davidson [ctb] (<https://orcid.org/0000-0002-5947-7490>) | https://github.com/cjbarrie/academictwitteR/issues | https://github.com/cjbarrie/academictwitteR | 2022-02-16 | Package to query the Twitter Academic Research Product Track, providing access to full-archive search and other v2 API endpoints. Functions are written with academic research in mind. They provide flexibility in how the user wishes to store collected data, and encourage regular storage of data to mitigate loss when collecting large volumes of tweets. They also provide workarounds to manage and reshape the format in which data is provided on the client side. | Access the Twitter Academic Research Product Track V2 API Endpoint |
| acc | 1.3.3 | R (>= 2.10), mhsmm | zoo, PhysicalActivity, nleqslv, plyr, methods, DBI, RSQLite, circlize, ggplot2, R.utils, iterators, Rcpp | GPL (>= 2) | TRUE | Jaejoon Song, Matthew G. Cox | NA | NA | 2016-12-16 | Processes accelerometer data from uni-axial and tri-axial devices, and generates data summaries. Also includes functions to plot, analyze, and simulate accelerometer data. | Exploring Accelerometer Data |
| acca | 0.2 | NA | methods, stats, ggplot2, plyr | GPL (>= 2) | FALSE | Livio Finos | NA | NA | 2022-01-28 | It performs Canonical Correlation Analysis and provides inferential guaranties on the correlation components. The p-values are computed following the resampling method developed in Winkler, A. M., Renaud, O., Smith, S. M., & Nichols, T. E. (2020). Permutation inference for canonical correlation analysis. NeuroImage, <doi:10.1016/j.neuroimage.2020.117065>. Furthermore, it provides plotting tools to visualize the results. | A Canonical Correlation Analysis with Inferential Guaranties |
| accelerometry | 3.1.2 | R (>= 3.0.0) | Rcpp (>= 0.12.15), dvmisc | GPL-3 | TRUE | Dane R. Van Domelen | NA | NA | 2018-08-24 | A collection of functions that perform operations on time-series accelerometer data, such as identify non-wear time, flag minutes that are part of an activity bout, and find the maximum 10-minute average count value. The functions are generally very flexible, allowing for a variety of algorithms to be implemented. Most of the functions are written in C++ for efficiency. | Functions for Processing Accelerometer Data |
| accelmissing | 1.4 | R (>= 2.10), mice, pscl | NA | GPL (>= 2) | FALSE | Jung Ae Lee <julee@uark.edu> | NA | NA | 2018-04-06 | Imputation for the missing count values in accelerometer data. The methodology includes both parametric and semi-parametric multiple imputations under the zero-inflated Poisson lognormal model. This package also provides multiple functions to pre-process the accelerometer data previous to the missing data imputation. These includes detecting wearing and non-wearing time, selecting valid days and subjects, and creating plots. | Missing Value Imputation for Accelerometer Data |
| accept | 0.9.1 | R (>= 3.6.0) | stats, dplyr, reldist, splines | GPL-3 | FALSE | Amin Adibi [aut, cre], Mohsen Sadatsafavi [aut, cph], Abdollah Safari [aut], Ainsleigh Hill [aut] | NA | NA | 2022-07-15 | Allows clinicians to predict the rate and severity of future acute exacerbation in Chronic Obstructive Pulmonary Disease (COPD) patients, based on the clinical prediction model published in Adibi et al. (2020) <doi:10.1016/S2213-2600(19)30397-2>. | The Acute COPD Exacerbation Prediction Tool (ACCEPT) |
| AcceptanceSampling | 1.0-8 | methods, R(>= 2.4.0), stats | graphics, utils | GPL (>= 3) | FALSE | Andreas Kiermeier [aut, cre], Peter Bloomfield [ctb] | NA | NA | 2022-04-06 | Provides functionality for creating and evaluating acceptance sampling plans. Sampling plans can be single, double or multiple. | Creation and Evaluation of Acceptance Sampling Plans |
| accessibility | 0.1.0 | R (>= 3.5.0) | checkmate, data.table, utils | MIT + file LICENSE | FALSE | Rafael H. M. Pereira [aut, cre] (<https://orcid.org/0000-0003-2125-7465>), Daniel Herszenhut [aut] (<https://orcid.org/0000-0001-8066-1105>), Ipea - Institute for Applied Economic Research [cph, fnd] | https://github.com/ipeaGIT/accessibility/issues | https://github.com/ipeaGIT/accessibility | 2022-06-30 | A set of fast and convenient functions to calculate multiple transport accessibility measures. Given a pre-computed travel cost matrix in long format combined with land-use data (e.g. location of jobs, healthcare, population), the package allows one to calculate active and passive accessibility levels using multiple accessibility metrics such as: cumulative opportunity measure (using either travel time cutoff or interval), minimum travel cost to closest N number of activities, gravitational measures and different floating catchment area methods. | Transport Accessibility Metrics |
| accessrmd | 1.0.0 | ggplot2, R (>= 2.10) | htmltools, stringr, rlist, knitr, RCurl | MIT + file LICENSE | FALSE | Rich Leyshon [aut, cre], Crown Copyright 2021 [cph] | NA | NA | 2022-05-03 | Provides a simple method to improve the accessibility of 'rmarkdown' documents. The package provides functions for creating or modifying 'rmarkdown' documents, resolving known errors and alerts that result in accessibility issues for screen reader users. | Improving the Accessibility of 'rmarkdown' Documents |
| accrual | 1.3 | R(>= 3.1.3), tcltk2 | fgui, SMPracticals | GPL-2 | FALSE | Junhao Liu, Yu Jiang, Cen Wu, Steve Simon, Matthew S. Mayo, Rama Raghavan, Byron J. Gajewski | NA | NA | 2017-10-20 | Subject recruitment for medical research is challenging. Slow patient accrual leads to delay in research. Accrual monitoring during the process of recruitment is critical. Researchers need reliable tools to manage the accrual rate. We developed a Bayesian method that integrates researcher's experience on previous trials and data from the current study, providing reliable prediction on accrual rate for clinical studies. In this R package, we present functions for Bayesian accrual prediction which can be easily used by statisticians and clinical researchers. | Bayesian Accrual Prediction |
| accrualPlot | 1.0.1 | lubridate | dplyr, ggplot2, grid, magrittr, purrr, rlang | MIT + file LICENSE | FALSE | Lukas Bütikofer [cre, aut], Alan G. Haynes [aut] | https://github.com/CTU-Bern/accrualPlot/issues | https://github.com/CTU-Bern/accrualPlot | 2022-05-09 | Tracking accrual in clinical trials is important for trial success. If accrual is too slow, the trial will take too long and be too expensive. If accrual is much faster than expected, time sensitive tasks such as the writing of statistical analysis plans might need to be rushed. 'accrualPlot' provides functions to aid the tracking of accrual and predict when a trial will reach it's intended sample size. | Accrual Plots and Predictions for Clinical Trials |
| accSDA | 1.1.1 | R (>= 3.2) | MASS (>= 7.3.45), ggplot2 (>= 2.1.0), ggthemes (>= 3.2.0), grid (>= 3.2.2), gridExtra (>= 2.2.1) | GPL (>= 2) | FALSE | Gudmundur Einarsson [aut, cre, trl], Line Clemmensen [aut, ths], Brendan Ames [aut], Summer Atkins [aut] | https://github.com/gumeo/accSDA/issues | https://github.com/gumeo/accSDA/wiki | 2022-04-05 | Implementation of sparse linear discriminant analysis, which is a supervised classification method for multiple classes. Various novel optimization approaches to this problem are implemented including alternating direction method of multipliers (ADMM), proximal gradient (PG) and accelerated proximal gradient (APG) (See Atkins et al. <arXiv:1705.07194>). Functions for performing cross validation are also supplied along with basic prediction and plotting functions. Sparse zero variance discriminant analysis (SZVD) is also included in the package (See Ames and Hong, <arXiv:1401.5492>). See the github wiki for a more extended description. | Accelerated Sparse Discriminant Analysis |
| accucor | 0.3.0 | NA | nnls, dplyr, stringr, readxl, readr, rlang, tibble, writexl, CHNOSZ | MIT + file LICENSE | FALSE | Xiaoyang Su [aut] (<https://orcid.org/0000-0001-8081-1396>), Lance Parsons [aut, cre] (<https://orcid.org/0000-0002-8521-714X>), Yujue Wang [ctb] (<https://orcid.org/0000-0001-7088-1729>), Princeton University [cph] | https://github.com/XiaoyangSu/AccuCor/issues | https://github.com/XiaoyangSu/AccuCor | 2021-11-17 | An isotope natural abundance correction algorithm that is needed especially for high resolution mass spectrometers. Supports correction for 13C, 2H and 15N. Su X, Lu W and Rabinowitz J (2017) <doi:10.1021/acs.analchem.7b00396>. | Natural Abundance Correction of Mass Spectrometer Data |
| ACDC | 1.0.0 | R (>= 3.5.0), ggplot2 | magrittr, deSolve, dplyr, tibble, colorspace, patchwork, latex2exp, tidyr | GPL-3 | FALSE | Bjørn Tore Kopperud [aut, cre], Sebastian Höhna [aut], Andrew F. Magee [aut] | NA | https://github.com/afmagee/ACDC | 2022-01-12 | Features tools for exploring congruent phylogenetic birth-death models. It can construct the pulled speciation- and net-diversification rates from a reference model. Given alternative speciation- or extinction rates, it can construct new models that are congruent with the reference model. Functionality is included to sample new rate functions, and to visualize the distribution of one congruence class. See also Louca & Pennell (2020) <doi:10.1038/s41586-020-2176-1>. | Analysis of Congruent Diversification Classes |
| acdcR | 1.0.0 | R (>= 4.0.0), raster, data.table, stats | NA | GPL (>= 2) | FALSE | Seong D. Yun [aut, cre] | NA | https://github.com/ysd2004/acdcR | 2022-06-27 | The functions are designed to calculate the most widely-used county-level variables in agricultural production or agricultural-climatic and weather analyses. To operate some functions in this package needs download of the bulk PRISM raster. See the examples, testing versions and more details from: <https://github.com/ysd2004/acdcR>. | Agro-Climatic Data by County |
| ACDm | 1.0.4.1 | R(>= 2.10.0) | plyr, dplyr, ggplot2, Rsolnp, zoo, graphics, | GPL (>= 2) | TRUE | Markus Belfrage | NA | NA | 2022-07-08 | Package for Autoregressive Conditional Duration (ACD, Engle and Russell, 1998) models. Creates trade, price or volume durations from transactions (tic) data, performs diurnal adjustments, fits various ACD models and tests them. | Tools for Autoregressive Conditional Duration Models |
Now you could take this data, aggregate the date_published by month, and plot the growth of the R ecosystem for yourself. For instance like this:
df %>%
  mutate(date = floor_date(ymd(date_published), unit = "month")) %>%
  filter(!is.na(date)) %>%
  count(date) %>%
  arrange(date) %>%
  mutate(cumul = cumsum(n)) %>%
  ggplot(aes(date, cumul)) +
  geom_line(col = "blue") +
  theme_minimal() +
  labs(x = "Date", y = "Cumlative count", title = "Cumulative count of CRAN package by date of latest version")
But this doesn’t really show you the true historical growth, does it? The x-axis range and my plot title are already telling you what’s going on here. The date_published that CRAN_package_db gives us (and that the CRAN website lists) corresponds to the last published version of the package. See for instance the entry for dplyr:
df %>%
  filter(package == "dplyr") %>%
  select(package, version, date_published) %>%
gt()| package | version | date_published |
|---|---|---|
| dplyr | 1.0.9 | 2022-04-28 |
The cornerstone of the tidyverse was first published a little while before April 2022. Version 1.0.9 is the most recent one, at the time of writing.
Naturally, that means that in this table those packages with frequent updates will be weighted heavier towards more recent dates. Which is perfectly fine if you’re only interested in the most recent package. But if you, like me, want to see how the R ecosystem grew over time, then you need the historical dates of the first published versions. This is where our next package comes in.
Package history
I found the packageRank package through googling “R package history”. Its documentation on github is detailed, and it performs very well for me. In the packageHistory function you give it a package name and it does the rest. Let’s find out more about the release history of our favourite dplyr package:
df_hist_dplyr <- packageRank::packageHistory(package = "dplyr", check.package = TRUE) %>%
    as_tibble() %>%
    janitor::clean_names()
df_hist_dplyr %>%
gt() %>%
tab_header(
title = md("**The release history of the dplyr package**")
) %>%
opt_row_striping() %>%
tab_options(container.height = px(400))| The release history of the dplyr package | |||
|---|---|---|---|
| package | version | date | repository |
| dplyr | 0.1 | 2014-01-16 | Archive |
| dplyr | 0.1.1 | 2014-01-29 | Archive |
| dplyr | 0.1.2 | 2014-02-24 | Archive |
| dplyr | 0.1.3 | 2014-03-15 | Archive |
| dplyr | 0.2 | 2014-05-21 | Archive |
| dplyr | 0.3 | 2014-10-04 | Archive |
| dplyr | 0.3.0.1 | 2014-10-08 | Archive |
| dplyr | 0.3.0.2 | 2014-10-11 | Archive |
| dplyr | 0.4.0 | 2015-01-08 | Archive |
| dplyr | 0.4.1 | 2015-01-14 | Archive |
| dplyr | 0.4.2 | 2015-06-16 | Archive |
| dplyr | 0.4.3 | 2015-09-01 | Archive |
| dplyr | 0.5.0 | 2016-06-24 | Archive |
| dplyr | 0.7.0 | 2017-06-09 | Archive |
| dplyr | 0.7.1 | 2017-06-22 | Archive |
| dplyr | 0.7.2 | 2017-07-20 | Archive |
| dplyr | 0.7.3 | 2017-09-09 | Archive |
| dplyr | 0.7.4 | 2017-09-28 | Archive |
| dplyr | 0.7.5 | 2018-05-19 | Archive |
| dplyr | 0.7.6 | 2018-06-29 | Archive |
| dplyr | 0.7.7 | 2018-10-16 | Archive |
| dplyr | 0.7.8 | 2018-11-10 | Archive |
| dplyr | 0.8.0 | 2019-02-14 | Archive |
| dplyr | 0.8.0.1 | 2019-02-15 | Archive |
| dplyr | 0.8.1 | 2019-05-14 | Archive |
| dplyr | 0.8.2 | 2019-06-29 | Archive |
| dplyr | 0.8.3 | 2019-07-04 | Archive |
| dplyr | 0.8.4 | 2020-01-31 | Archive |
| dplyr | 0.8.5 | 2020-03-07 | Archive |
| dplyr | 1.0.0 | 2020-05-29 | Archive |
| dplyr | 1.0.1 | 2020-07-31 | Archive |
| dplyr | 1.0.2 | 2020-08-18 | Archive |
| dplyr | 1.0.3 | 2021-01-15 | Archive |
| dplyr | 1.0.4 | 2021-02-02 | Archive |
| dplyr | 1.0.5 | 2021-03-05 | Archive |
| dplyr | 1.0.6 | 2021-05-05 | Archive |
| dplyr | 1.0.7 | 2021-06-18 | Archive |
| dplyr | 1.0.8 | 2022-02-08 | Archive |
| dplyr | 1.0.9 | 2022-04-28 | CRAN |
First released in January 2014. It’s been an interesting journey for the tidyverse since then. I started using the tidy packages first in 2017, and I would find it hard to go back to base R now.
With data like this for a single R package, you could for instance investigate the yearly frequency of releases over time:
df_hist_dplyr %>%
  mutate(year = floor_date(date, unit = "year")) %>%
  count(year) %>%
  ggplot(aes(year, n)) +
  geom_col(fill = "purple") +
  scale_x_date() +
  theme_hc() +
  labs(x = "", y = "", title = "Number of releases of 'dplyr' per year - in July 2022")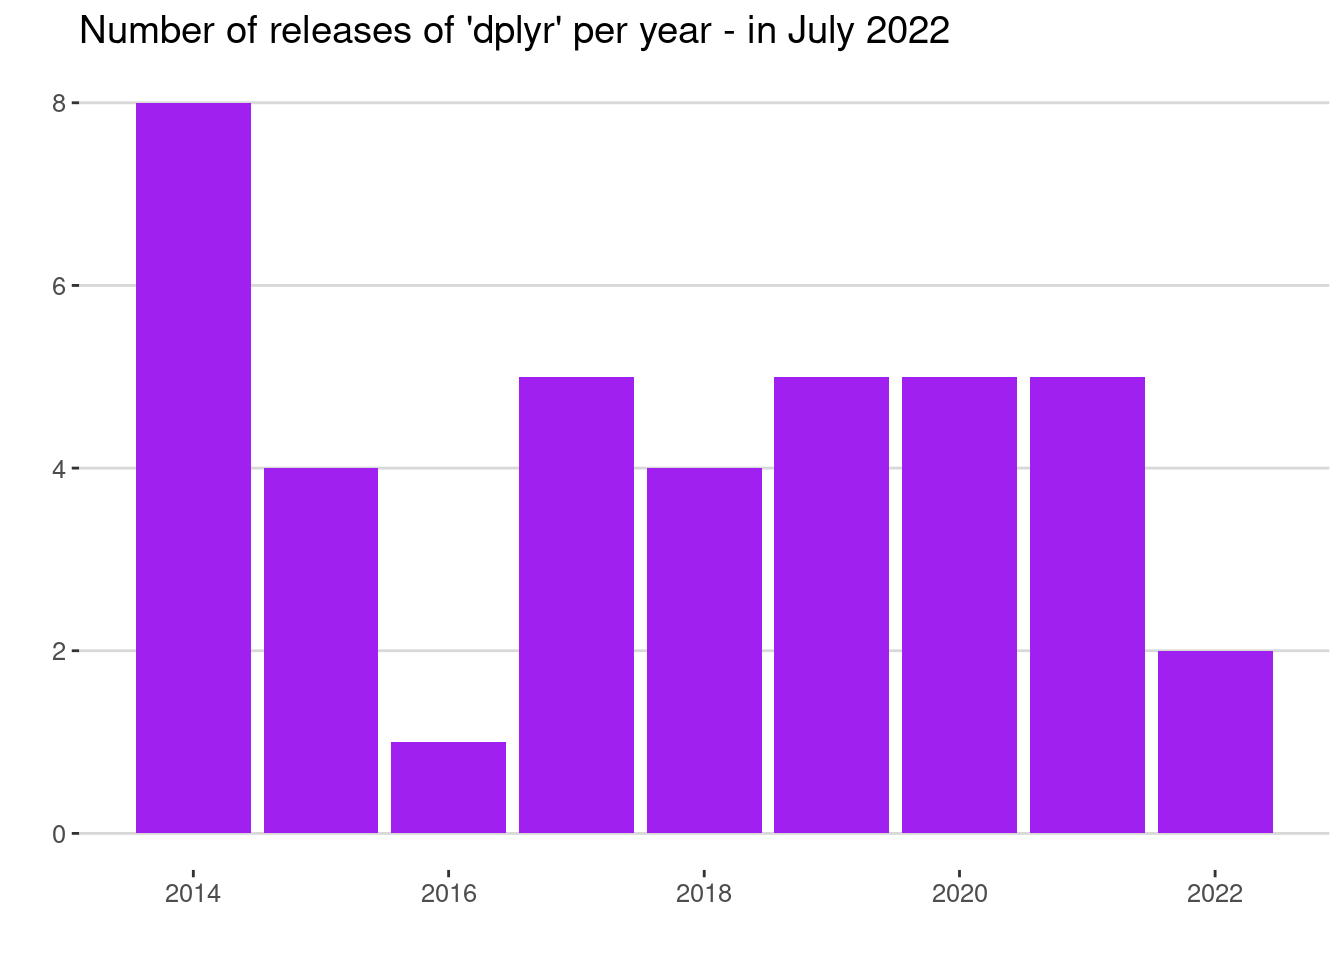
Interesting pattern there from 2014 to 2016. Since then the number of releases have been pretty consistent. At the time of writing, we are still in the middle of 2022.
(As a side note, you’ll see that I’ve decided not to use an x-axis label here. I feel like a year axis is often self-explanatory; and I’ve used a descriptive title to prevent misinterpretation. Let me know if you disagree.)
To get the history for all the entries in our complete list of CRAN packages, we can then simply loop through the package names. The loop takes about an hour, but you don’t have to run it yourself. This is what I created the Kaggle dataset for. You can download “cran_package_history.csv” and start working with it immediately.
df_hist <- read_csv("../../static/files/cran_package_history.csv", col_types = cols())Here are the first 50 rows:
df_hist %>%
  head(50) %>%
  gt() %>%
  tab_header(
    title = md("**The first rows of the cran_package_history.csv table**")
    ) %>%
  opt_row_striping() %>%
tab_options(container.height = px(400))| The first rows of the cran_package_history.csv table | |||
|---|---|---|---|
| package | version | date | repository |
| A3 | 0.9.1 | 2013-02-07 | Archive |
| A3 | 0.9.2 | 2013-03-26 | Archive |
| A3 | 1.0.0 | 2015-08-16 | CRAN |
| AATtools | 0.0.1 | 2020-06-14 | CRAN |
| ABACUS | 1.0.0 | 2019-09-20 | CRAN |
| abbreviate | 0.1 | 2021-12-14 | CRAN |
| abbyyR | 0.1 | 2015-06-12 | Archive |
| abbyyR | 0.2 | 2015-09-12 | Archive |
| abbyyR | 0.2.1 | 2015-11-04 | Archive |
| abbyyR | 0.2.2 | 2015-11-06 | Archive |
| abbyyR | 0.2.3 | 2015-12-06 | Archive |
| abbyyR | 0.3 | 2016-02-04 | Archive |
| abbyyR | 0.4.0 | 2016-05-16 | Archive |
| abbyyR | 0.5.0 | 2016-06-20 | Archive |
| abbyyR | 0.5.1 | 2017-04-12 | Archive |
| abbyyR | 0.5.3 | 2018-05-28 | Archive |
| abbyyR | 0.5.4 | 2018-05-30 | Archive |
| abbyyR | 0.5.5 | 2019-06-25 | CRAN |
| abc | 1.0 | 2010-10-05 | Archive |
| abc | 1.1 | 2010-10-11 | Archive |
| abc | 1.2 | 2011-01-15 | Archive |
| abc | 1.3 | 2011-05-10 | Archive |
| abc | 1.4 | 2011-09-04 | Archive |
| abc | 1.5 | 2012-08-08 | Archive |
| abc | 1.6 | 2012-08-14 | Archive |
| abc | 1.7 | 2013-06-06 | Archive |
| abc | 1.8 | 2013-10-29 | Archive |
| abc | 2.0 | 2014-07-11 | Archive |
| abc | 2.1 | 2015-05-05 | Archive |
| abc | 2.2.1 | 2022-05-19 | CRAN |
| abc.data | 1.0 | 2015-05-05 | CRAN |
| ABC.RAP | 0.9.0 | 2016-10-20 | CRAN |
| abcADM | 1.0 | 2019-11-13 | CRAN |
| ABCanalysis | 1.0 | 2015-02-13 | Archive |
| ABCanalysis | 1.0.1 | 2015-04-20 | Archive |
| ABCanalysis | 1.0.2 | 2015-06-15 | Archive |
| ABCanalysis | 1.1.0 | 2015-09-28 | Archive |
| ABCanalysis | 1.1.1 | 2016-06-15 | Archive |
| ABCanalysis | 1.1.2 | 2016-08-23 | Archive |
| ABCanalysis | 1.2.1 | 2017-03-13 | CRAN |
| abclass | 0.1.0 | 2022-03-07 | Archive |
| abclass | 0.2.0 | 2022-04-12 | Archive |
| abclass | 0.3.0 | 2022-05-28 | CRAN |
| ABCoptim | 0.13.10 | 2013-10-21 | Archive |
| ABCoptim | 0.13.11 | 2013-11-06 | Archive |
| ABCoptim | 0.14.0 | 2016-11-17 | Archive |
| ABCoptim | 0.15.0 | 2017-11-06 | CRAN |
| ABCp2 | 1.0 | 2013-04-10 | Archive |
| ABCp2 | 1.1 | 2013-07-23 | Archive |
| ABCp2 | 1.2 | 2016-02-04 | CRAN |
Now we can filter the initial release date for each package and visualise the number of CRAN packages created over time:
df_hist %>%
  group_by(package) %>%
  slice_min(order_by = date, n = 1) %>%
  ungroup() %>%
  mutate(month = floor_date(date, unit = "month")) %>%
  count(month) %>%
  arrange(month) %>%
  mutate(cumul = cumsum(n)) %>%
  ggplot(aes(month, cumul)) +
  geom_line(col = "purple") +
  theme_minimal() +
  labs(x = "Date", y = "Cumlative count", title = "Cumulative count of CRAN package by date of first release")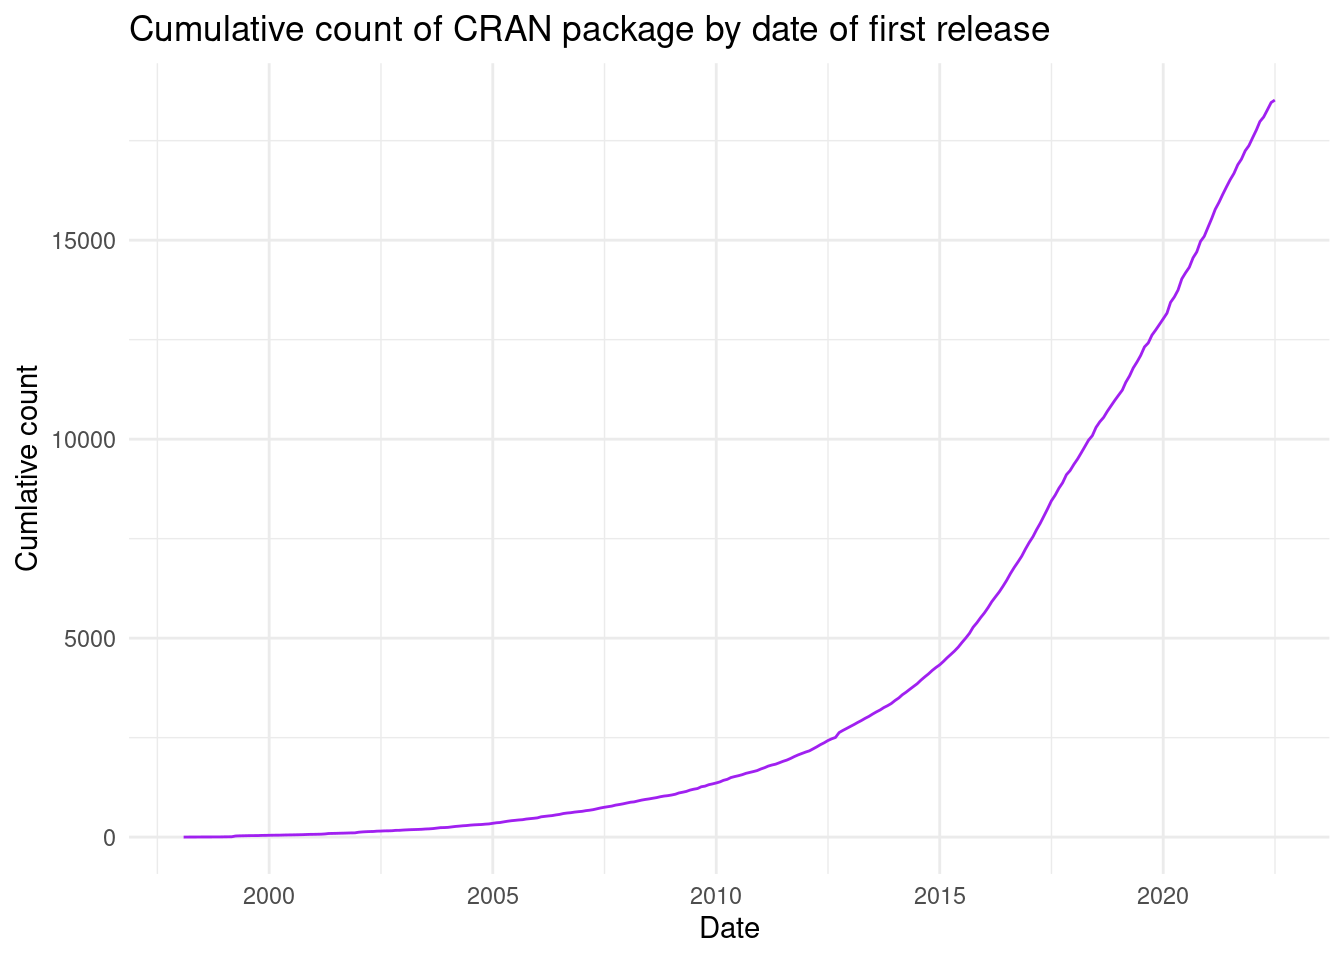
Still an impressive growth, and now we give proper emphasis to the early history of CRAN; reaching back all the way to before the year 2000. There are many more angles and visuals that this dataset will allow you to explore.
Notes and suggestions:
I will keep updating this dataset on a monthly basis. After the initial collection of all the version histories, from now on I only need to update the histories for those packages that have a new version released. This should simplify the process significantly.
Some ideas for EDA and analysis: how long did packages take from their first release to version 1.0? What type of packages were most frequent in different years? Who are the most productive authors? Can you predict the growth toward 2025?
All of this analysis can be done directly on the Kaggle platform! On the dataset page, on the top right, you will see a button called “New Notebook”. Click that to get an interactive editor in R or Python and start exploring immediately.
Have fun!